Financial results by major fund — Acquisition Services Fund
The ASF is a revolving fund that operates from the reimbursable revenue generated by its business portfolios rather than from an appropriation received from Congress. The operations of the ASF are organized into six main business portfolios:
- General supplies and services.
- Travel, transportation, and logistics.
- IT category.
- Assisted acquisition services.
- Professional services and human capital.
- Technology Transformation Services.
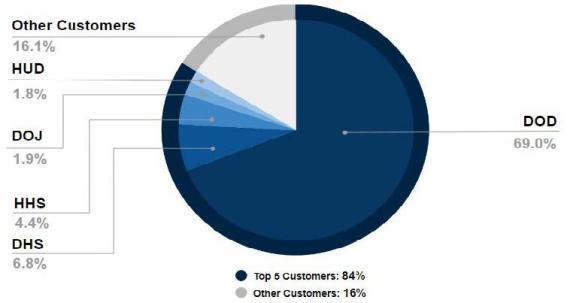
Table 5. ASF Customers (dollars in millions)
| Customers |
Revenue |
Percentage of total revenue |
| U.S. Department of Defense |
$14,262 |
69% |
| U.S. Department of Homeland Security |
$1,401 |
6.8% |
| U.S. Department of Health and Human Services |
$915 |
4.4% |
| U.S. Department of Justice |
$400 |
1.9% |
| U.S. Department of Housing and Urban Development |
$366 |
1.8% |
| All other customers |
$3,324 |
16.1% |
| Total |
$20,668 |
100% |
ASF net revenues from operations
ASF net revenue from operations represents the revenue remaining after deducting the costs of goods and services sold and the cost of operations. In FY 2022, the ASF reported positive financial results, producing net revenues from operations of $333 million compared to $465 million in FY 2021. AAS programs have continued to experience increased revenue of 4% in the past fiscal year, with revenues of $15 billion in FY 2022, up from $14 billion in FY 2021, as both the volume and dollar magnitude of goods and services AAS provides continues to increase year-to-year. This increased business volume outpaced the costs necessary to support that business volume and resulted in an increase of $535 million in AAS net operating results compared to FY 2021. The TTL business line increased revenue by $497 million over FY 2021 with two main factors driving those changes. In FY 2022, we moved the Internal and Emergency Acquisition Center Program from the GS&S business line to the TTL business line, accounting for $249 million. Second, travel and transportation programs have seen considerable improvements to revenue due to increased volume in transportation and travel services and accounting for $186 million.
Revenue generated from the ITC business line is lower due to the transition to the Enterprise Infrastructure Solutions contract.
ASF obligations and outlays
ASF obligations and outlays are primarily driven by contracts awarded to commercial vendors providing goods and services in support of the ASF program and activities. New obligations and upward adjustments increased by $2.1 billion between FY 2022 and FY 2021 due to the large increase in ASF business volume and by an increase in outstanding unfilled customer orders driven by supply chain delays. The total amount of collections continued to exceed disbursements as reflected in the decrease in net outlays of $237 million.
Table 6. ASF obligations and outlays (dollars in millions)
| Obligations and outlays |
2022 |
2021 |
Dollar change |
Percentage change |
| New obligations and upward adjustments |
$23,680 |
$21,601 |
$2,079 |
9.6% |
| Net outlays (receipts) from operating activities |
$(280) |
$(517) |
$237 |
(45.8)% |
Limitations of financial statements
The principal financial statements are prepared to report the financial position and results of operations, pursuant to the requirements of 31 U.S.C. § 3515 (b). The statements are prepared from our books and records in accordance with Federal GAAP and the formats the Office of Management and Budget prescribes. Reports used to monitor and control budgetary resources are prepared from the same books and records. The financial statements should be read with the understanding that they are for a component of the U.S. Government.

 U.S. General Services Administration

