The financial statements and financial data presented in this report have been prepared from our agency’s accounting records in conformity with generally accepted accounting principles, as prescribed by the Federal Accounting Standards Advisory Board.
Consolidated financial results
Our assets
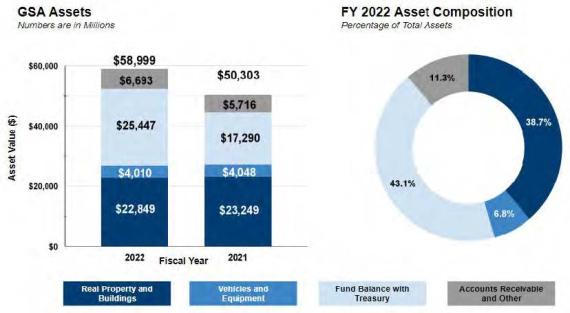
Our assets primarily include property and equipment, Fund Balance with Treasury and Accounts Receivable. The majority of property and equipment for our agency are federal buildings, motor vehicles, and office equipment. GSA Accounts Receivable are primarily derived from amounts due to us from federal agencies and non-federal customers for goods or services provided or uncollected rent.
In fiscal year 2022 we recorded a net increase of approximately $8.7 billion in assets. Significant changes in assets are attributable to an increase in the overall FBwT of $8.2 billion due to the funding received by the Federal Buildings Fund from the Inflation Reduction Act of 2022 (P.L. 117-169) of approximately $3.4 billion and the Infrastructure Investment and Jobs Act (P.L. 117-58) funding of approximately $3.4 billion. Net revenue in the FBF also contributed an additional $1 billion to the increase in FBwT.
Our accounts receivable from other federal agencies increased by $924 million, principally due to increases in Acquisition Services Fund business volume.
Our liabilities
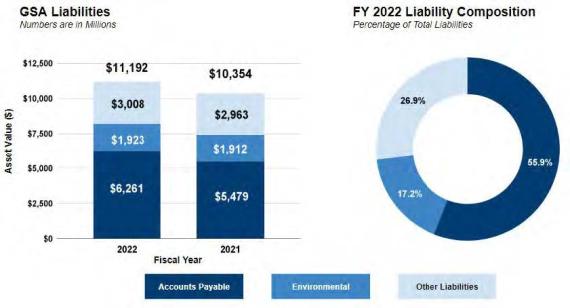
Our liabilities are primarily amounts owed to commercial vendors for goods and services received but not yet paid (Accounts Payable), amounts we owe to other federal entities, and long-term estimates of future environmental remediation costs.
In FY 2022, total liabilities were $11.2 billion, a net increase of $838 million compared to FY 2021 total liabilities of $10.4 billion. The increase in accounts payable is comparative to the increase in accounts receivable and also attributable to increased business volume in the ASF.
Our net results
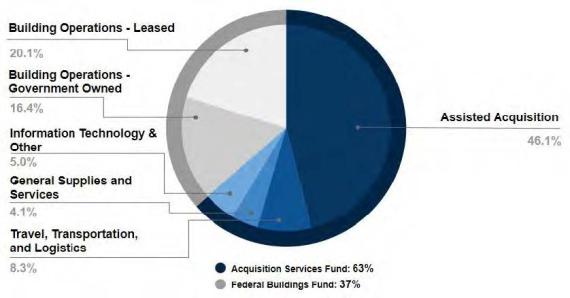
The Consolidating Statements of Net Cost present the revenues and expenses incurred by providing goods and services to our customers and executing our programs, displayed by major components and activity. We reported almost $32.4 billion in revenue during FY 2022 compared to $31.7 billion reported in FY 2021, which were matched by expenses of $31.9 billion and $30.8 billion, respectively. Changes in the FBF and ASF net operating results are presented further below.
Table 1. Revenue by major business line (dollars in millions)
| Fund |
Major business line |
FY 2022 |
FY 2021 |
Dollar change |
Percentage change |
| ASF |
Assisted acquisition |
$15,017 |
$14,482 |
$535 |
4% |
| ASF |
Travel, transportation and logistics |
$2,692 |
$2,195 |
$497 |
23% |
| ASF |
General supplies and services |
$1,345 |
$1,359 |
$(14) |
(1)% |
| ASF |
IT |
$1,295 |
$1,650 |
$(355) |
(22)% |
| ASF |
Professional services and human capital |
$116 |
$111 |
$5 |
5% |
| ASF |
Other programs |
$203 |
$167 |
$36 |
22% |
| FBF |
Building operations - Government owned |
$5,334 |
$5,377 |
$(43) |
(1)% |
| FBF |
Building operations - Leased |
$6,561 |
$6,531 |
$30 |
—% |
| This table shows gross revenue by our major business lines. It does not include appropriations or funding transferred within our agency. (See the Consolidating Statement of Net Cost for details.) |
Our budget
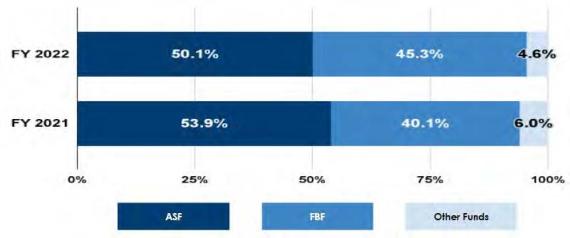
Our Total Budgetary Resources, reported on the Statement of Budgetary Resources, increased in FY 2022 by $10.0 billion due to increases in both the FBF and the ASF. The FBF budget and the ending unobligated balance increased by approximately $7 billion, primarily due to $6.8 billion in enacted appropriations from the Inflation Reduction Act of 2022 and the Infrastructure Investment and Jobs Act. We also reported significant increases in spending authority from offsetting collections and obligations in the ASF. Generally this type of spending authority is created by the revenues and customer orders received from federal agencies and is also referred to as reimbursable spending authority. The ASF reflected an increase of $2.8 billion in reimbursable spending authority.
Table 2. Budget by fund (dollars in millions)
| GSA fund |
FY 2022 |
FY 2021 |
Dollar change |
Percentage change |
| Acquisitions Services Fund |
$26,933 |
$23,698 |
$3,235 |
14% |
| Federal Buildings Fund |
$24,350 |
$17,418 |
$6,932 |
40% |
| Other funds |
$2,473 |
$2,625 |
$(152) |
(6)% |
| Total budget |
$53,756 |
$43,741 |
$10,015 |
23% |

 U.S. General Services Administration

